
Empower your year-end reporting with SAP Analytics Cloud
SAP Credit Management
DECEMBER 29, 2022
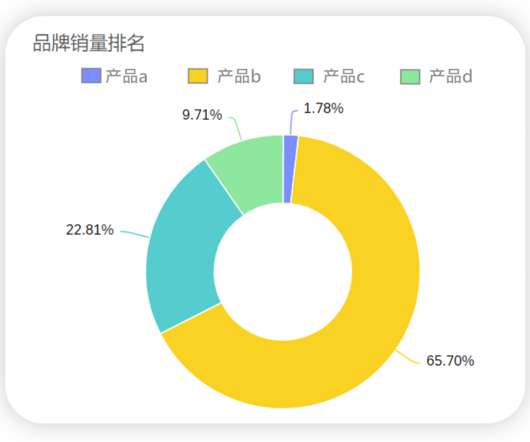
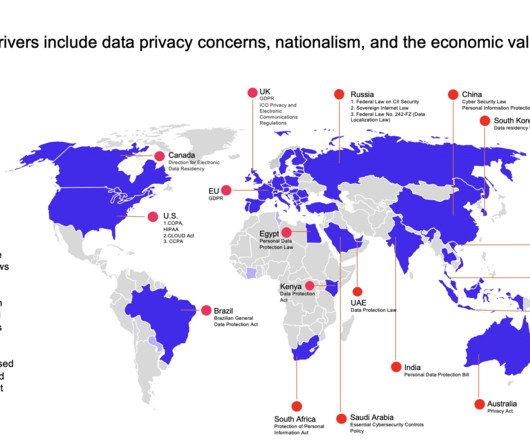
For example, in Figure 5, which depicts the sales performance of a virtual company in 2020, we can see that the company has outstanding sales performance in May. Practice makes perfect, so I hope you could kindly apply what you’ve learned to your dashboard design. Data involving regional distribution is most intuitive with maps.


Let's personalize your content